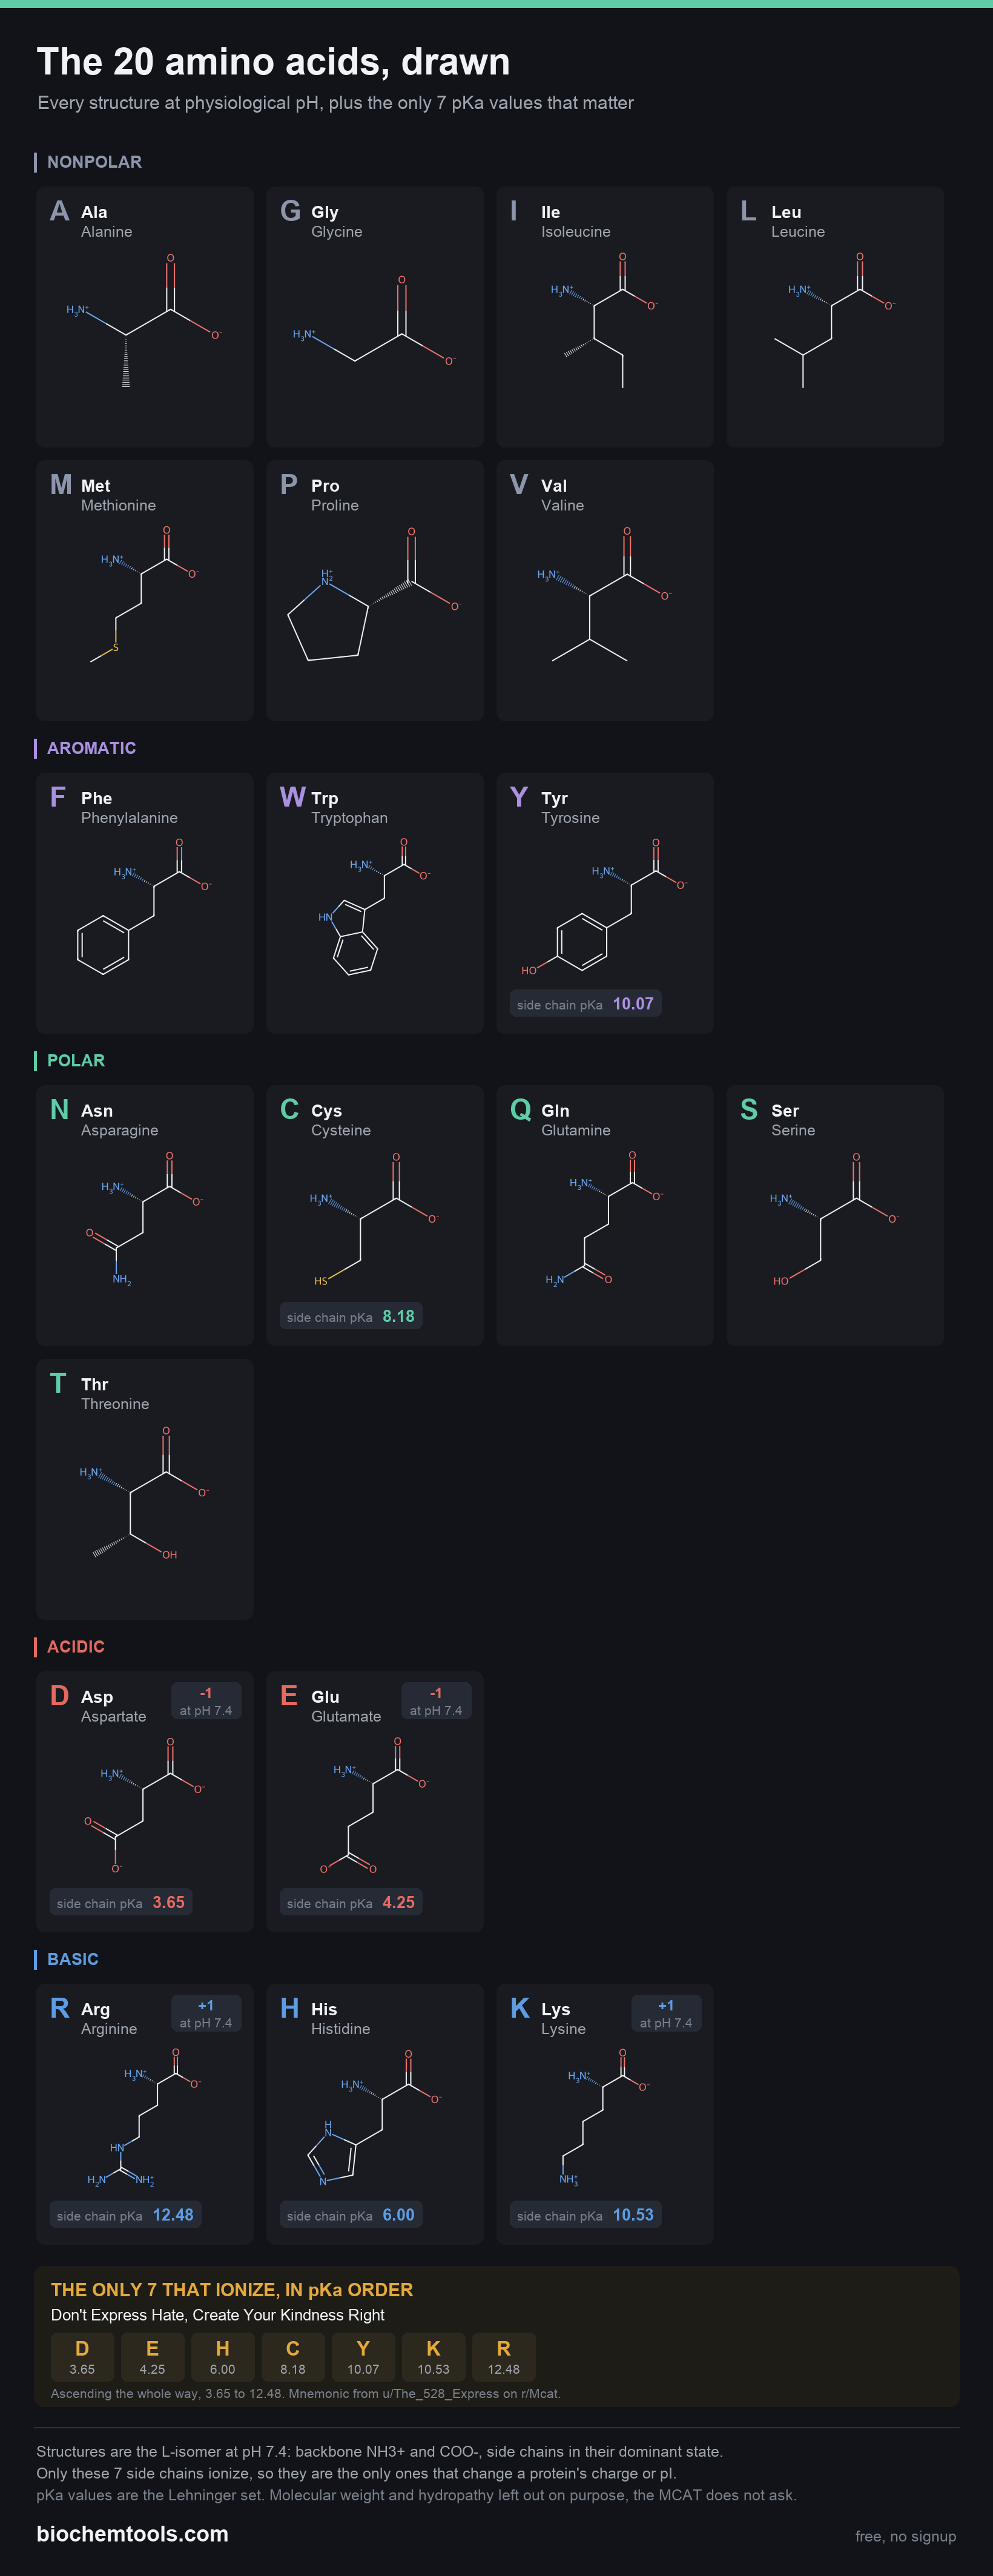
The 20 amino acids, drawn at physiological pH
Every amino acid drawn as it exists at pH 7.4, grouped by side-chain class, with the seven ionizable side-chain pKa values and the DEHCYKR ordering.
Open the interactive version, or download the chart
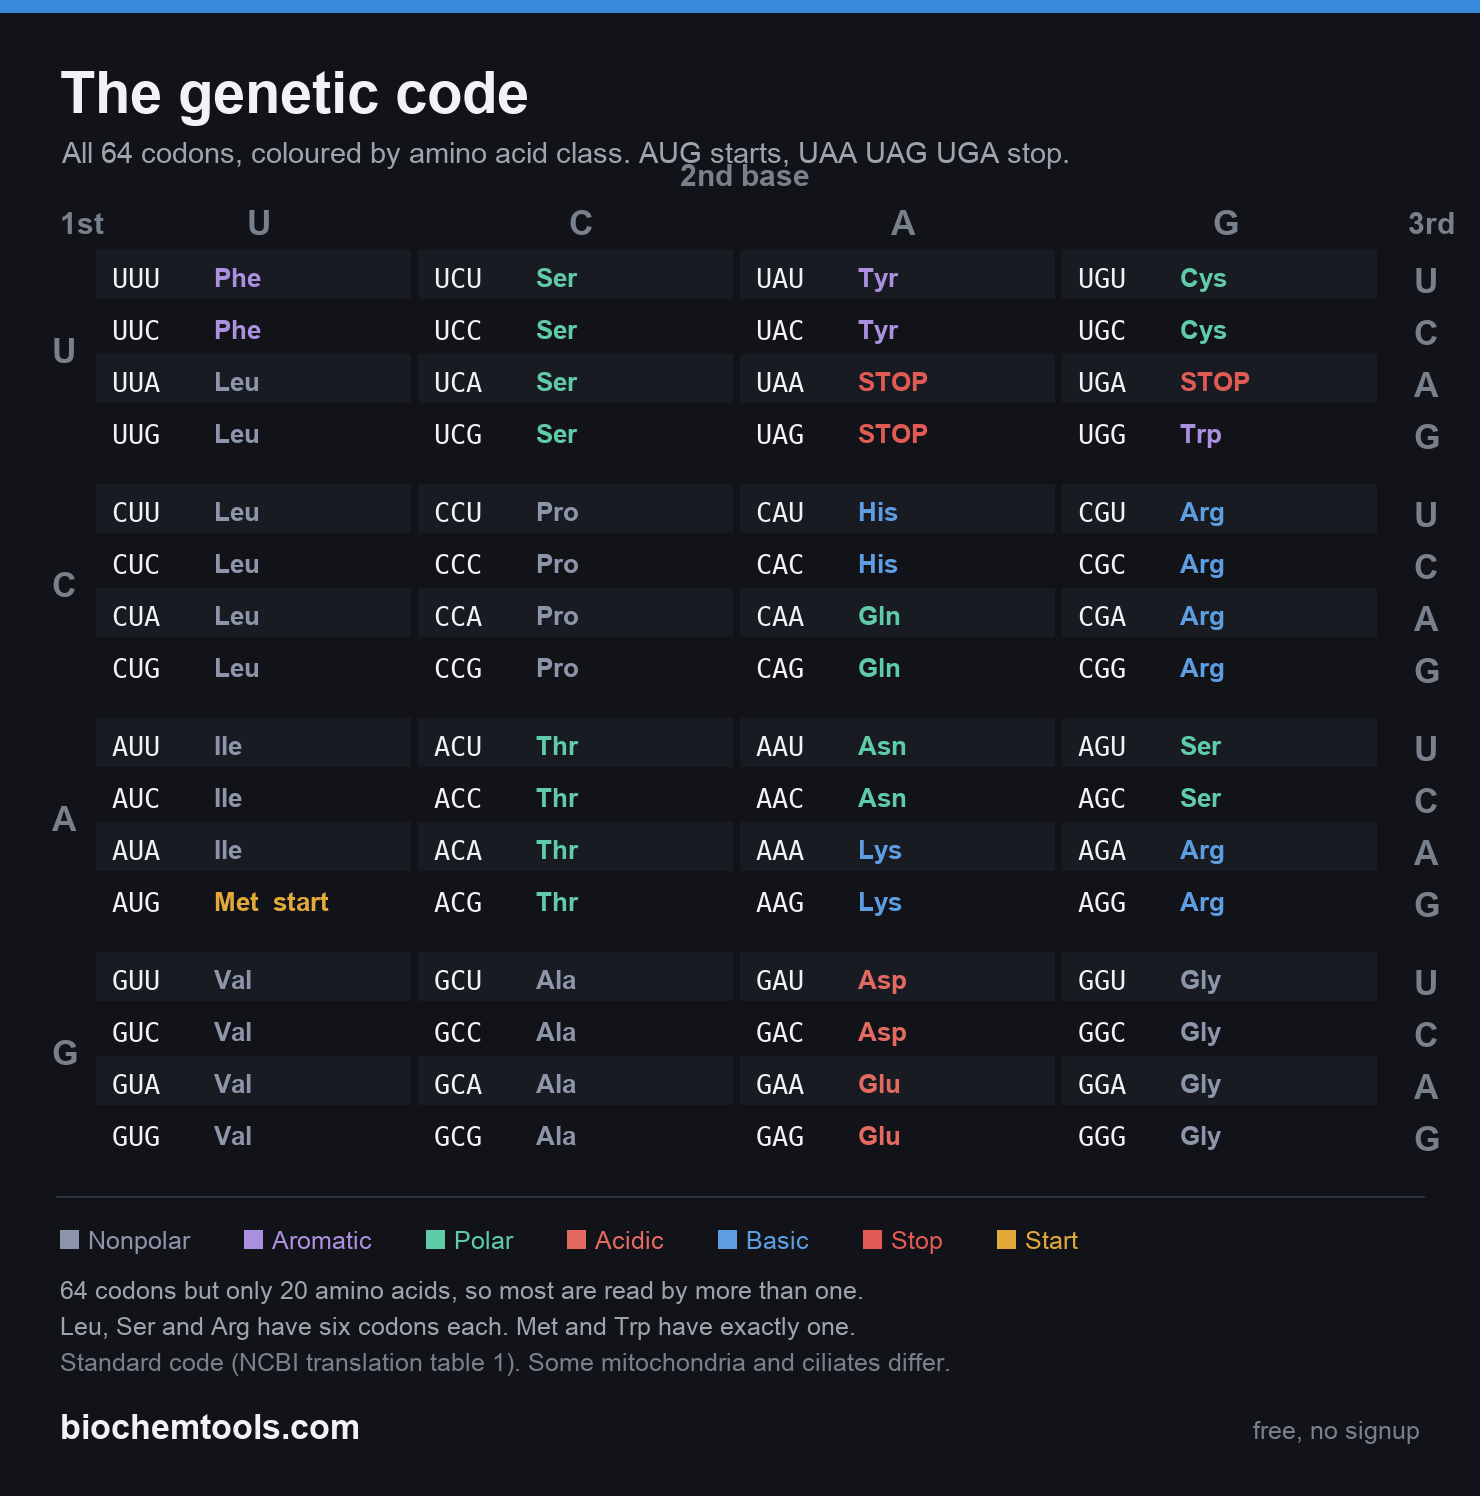
The genetic code, all 64 codons
Every codon in NCBI translation table 1, laid out by first, second and third base and coloured by amino acid class, with start and stop marked.
Open the interactive version, or download the chart
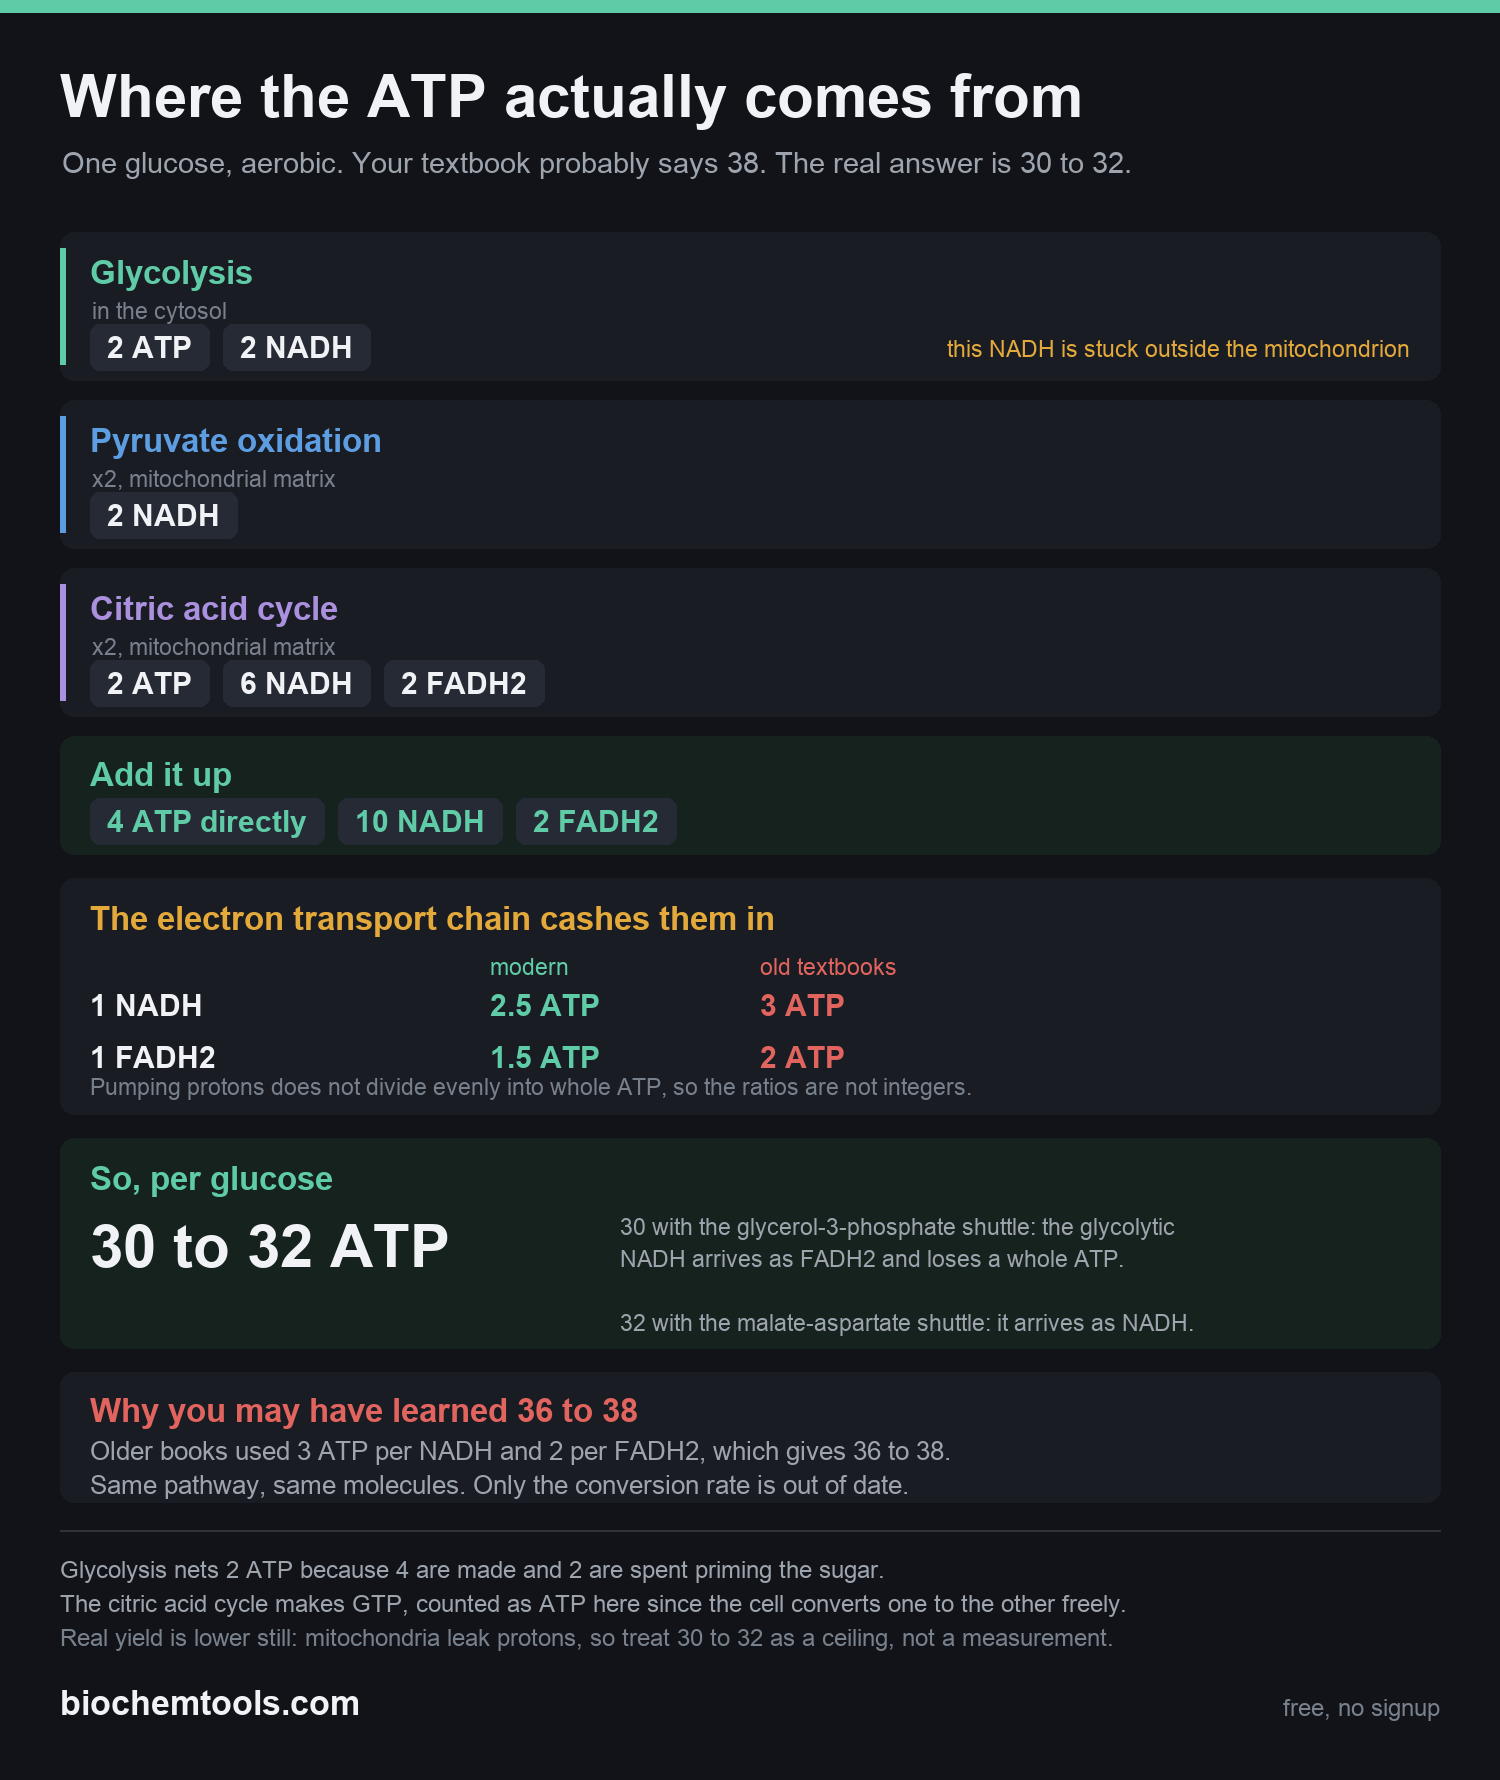
ATP yield per glucose, 30 to 32 not 38
Where the ATP from one glucose comes from, and why the modern figure is 30 to 32 rather than the 36 to 38 older textbooks give.
Open the interactive version, or download the chart
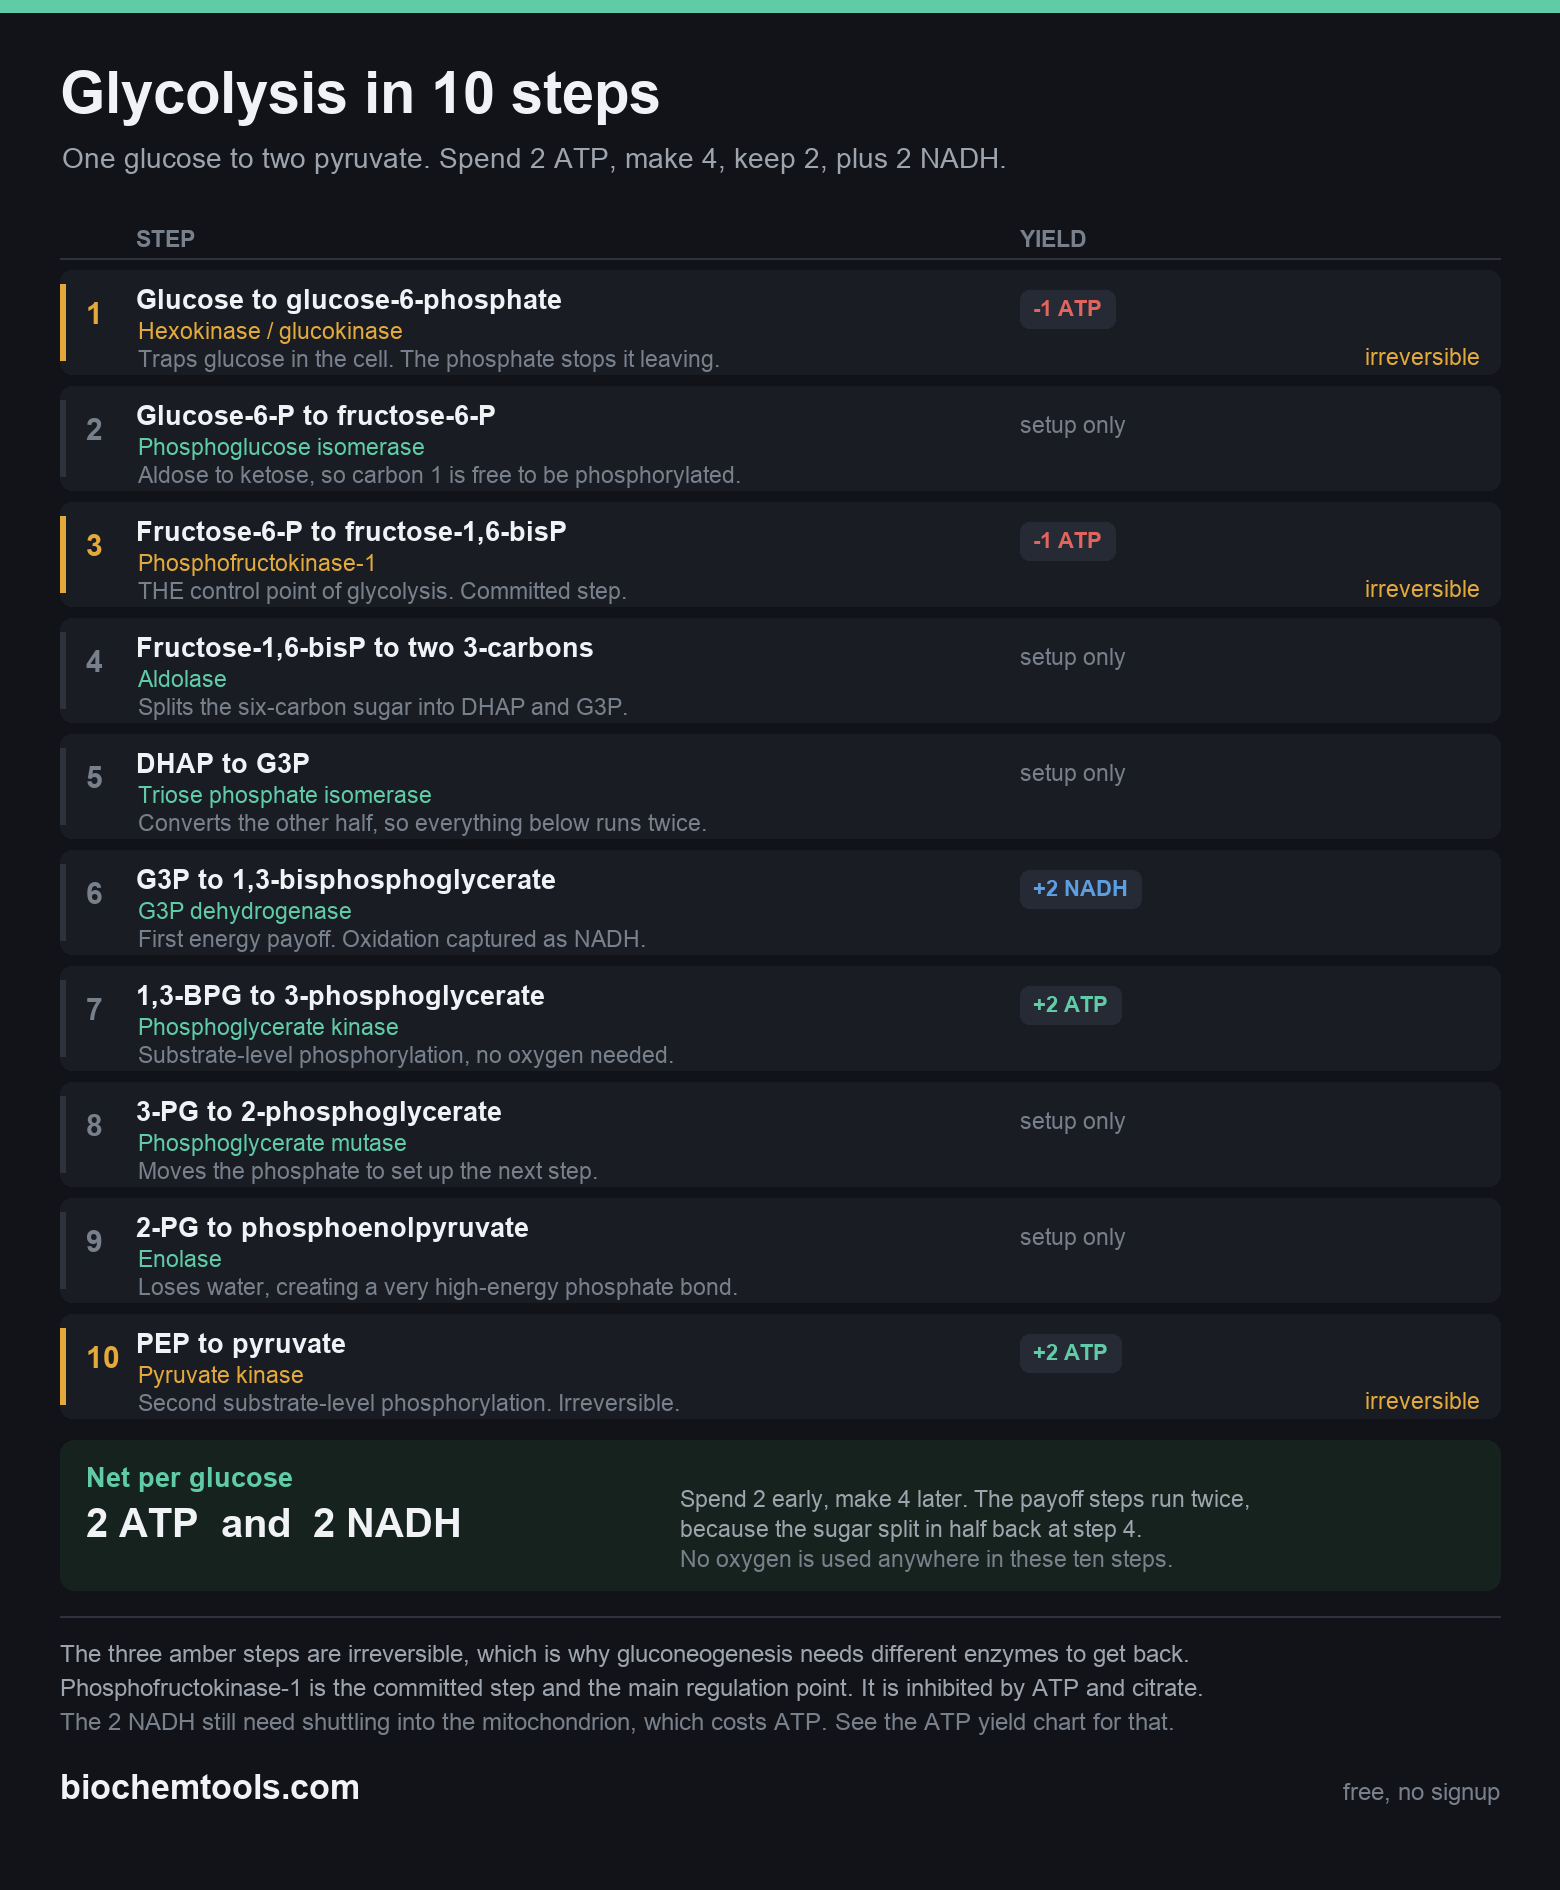
Glycolysis in 10 steps
All ten steps with the enzyme for each, where ATP is spent and made, and which three steps are irreversible.
Open the interactive version, or download the chart
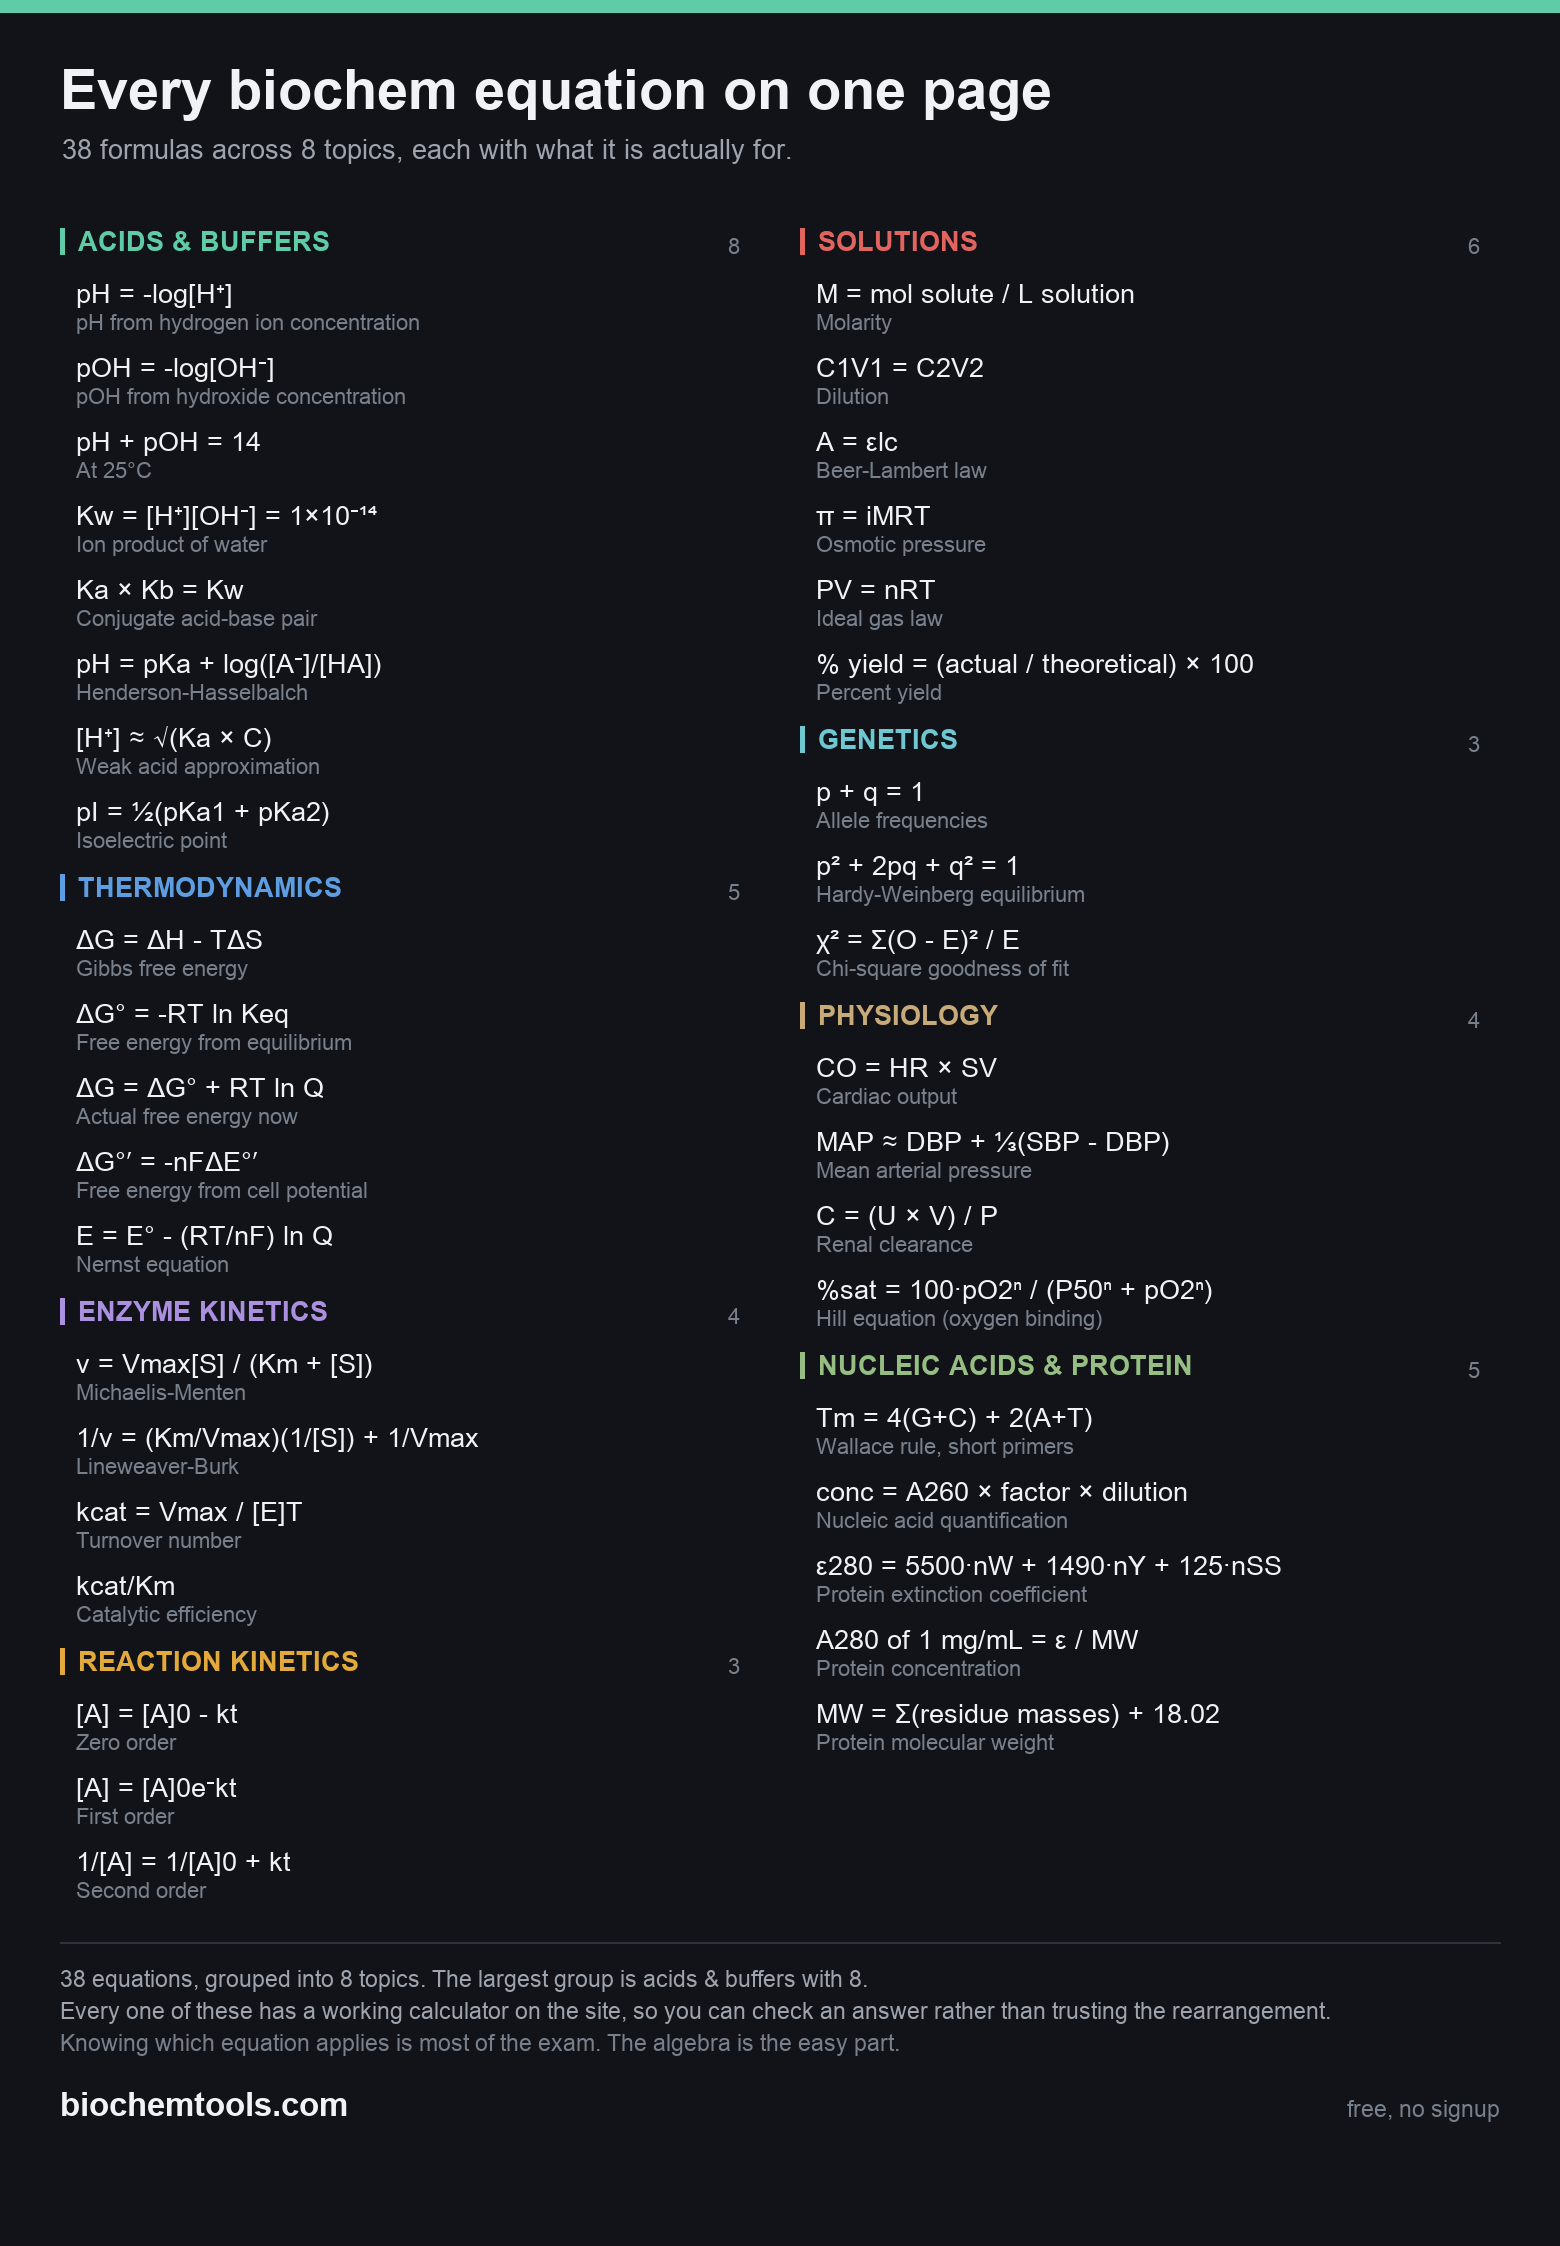
Every biochem equation on one page
38 biochemistry formulas across 8 topics, each labelled with what it is actually used for.
Open the interactive version, or download the chart
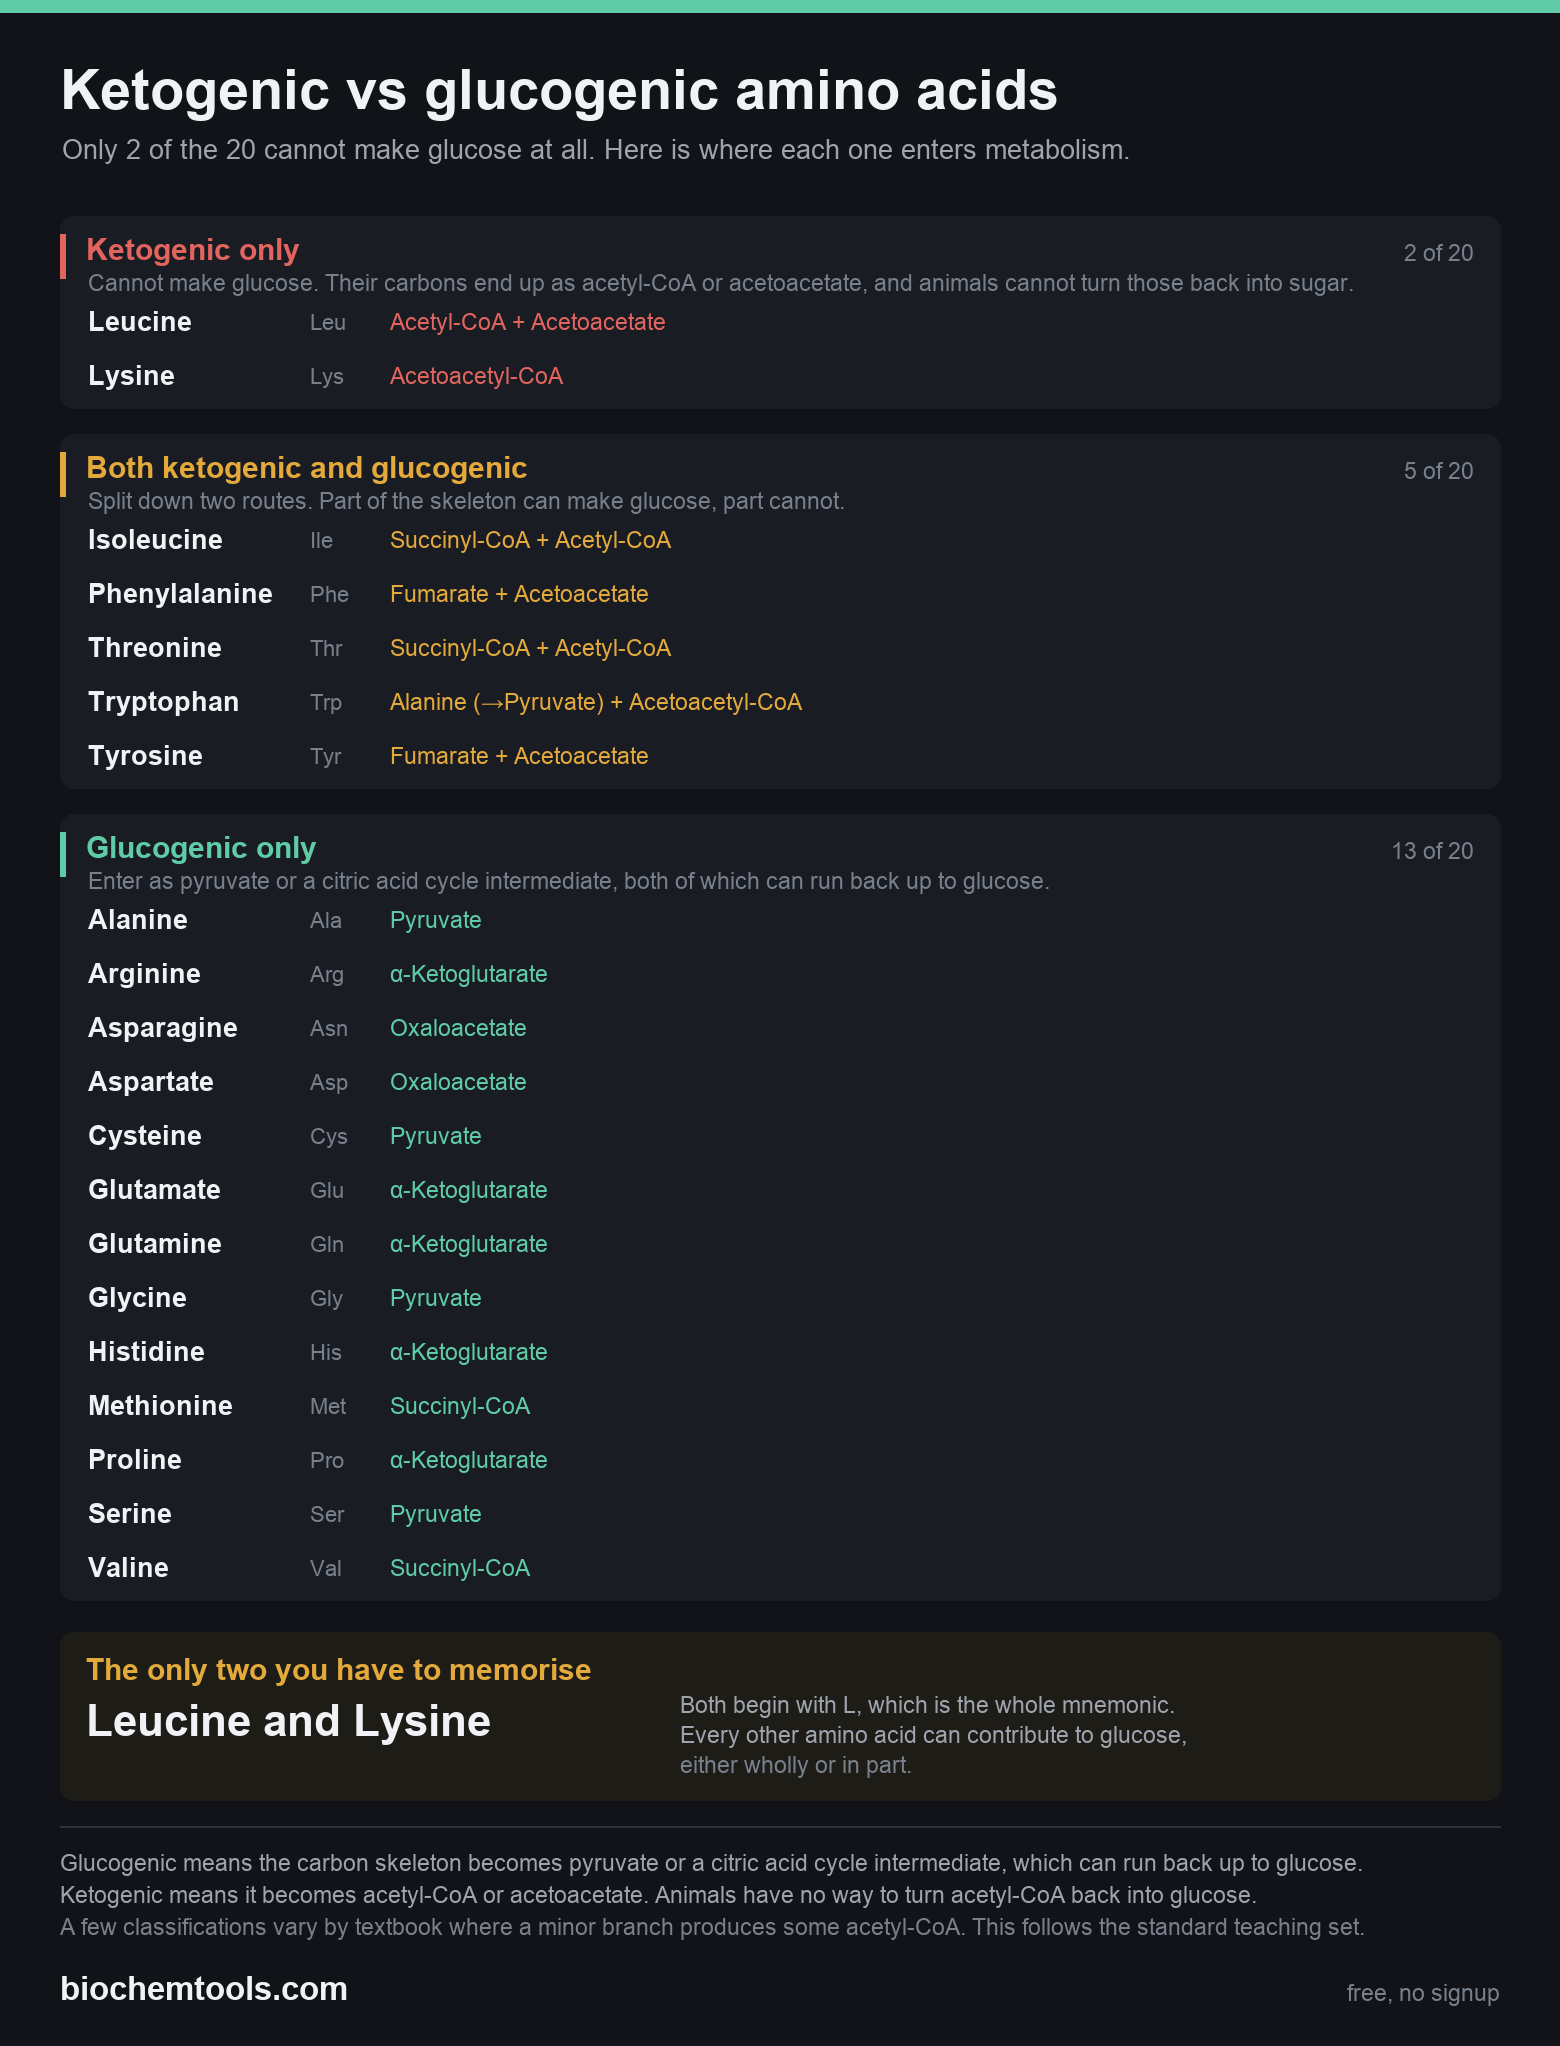
Ketogenic vs glucogenic amino acids
All 20 amino acids grouped by whether they can make glucose, with the metabolic entry point for each. Only leucine and lysine are purely ketogenic.
Open the interactive version, or download the chart

The urea cycle in 5 steps
All five enzymes with their compartment, where each nitrogen atom enters, and the true ATP cost of 4 equivalents per turn.
Open the interactive version, or download the chart
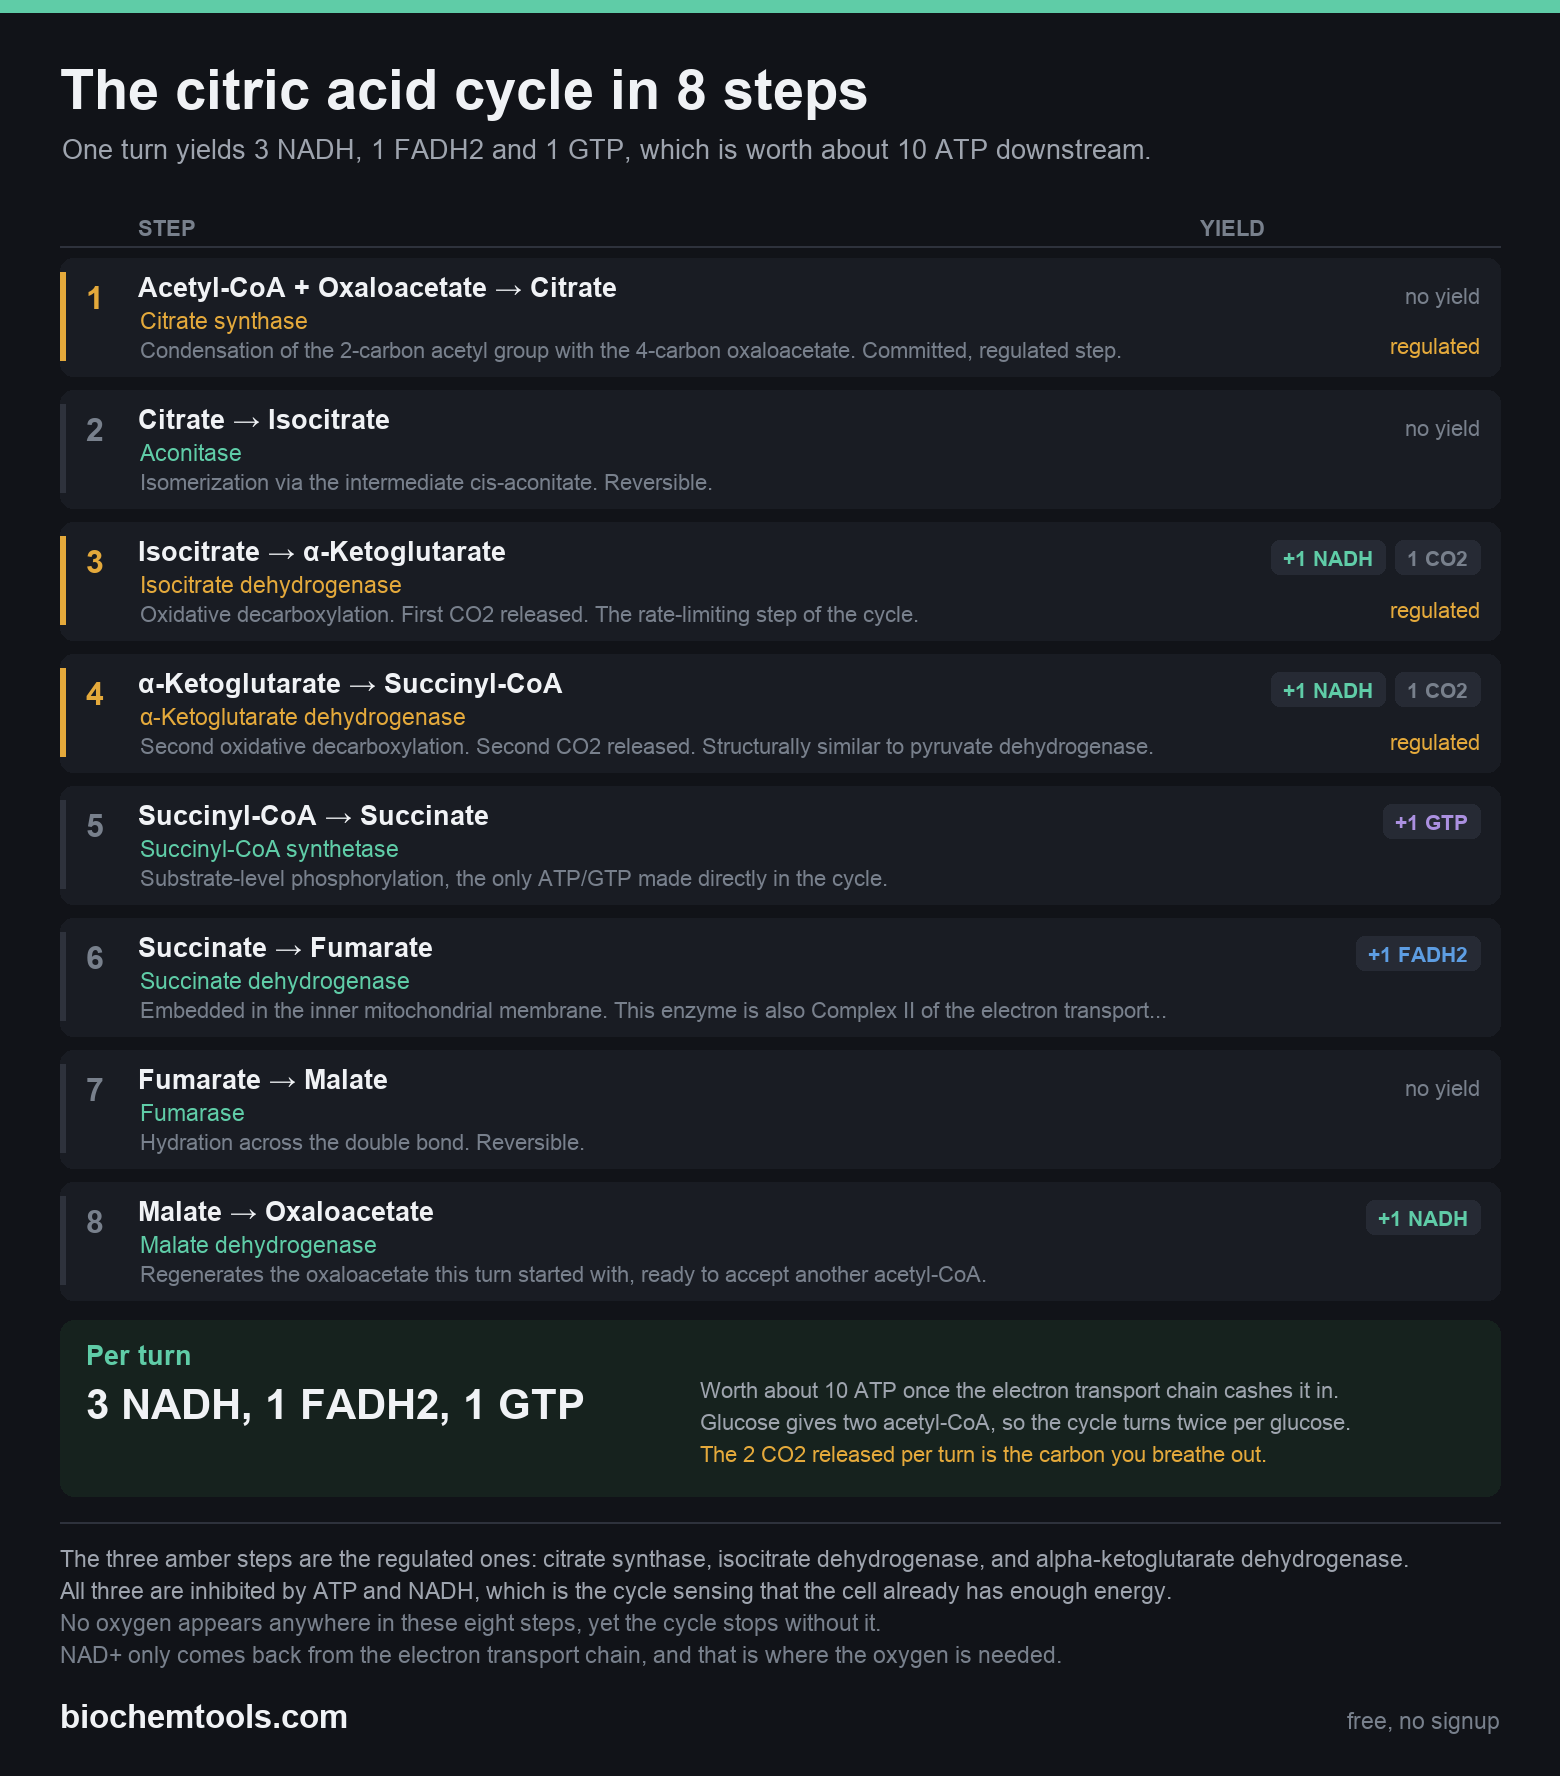
The citric acid cycle in 8 steps
All eight reactions with their enzyme, the NADH, FADH2, GTP and CO2 from each, and the three regulated steps marked.
Open the interactive version, or download the chart
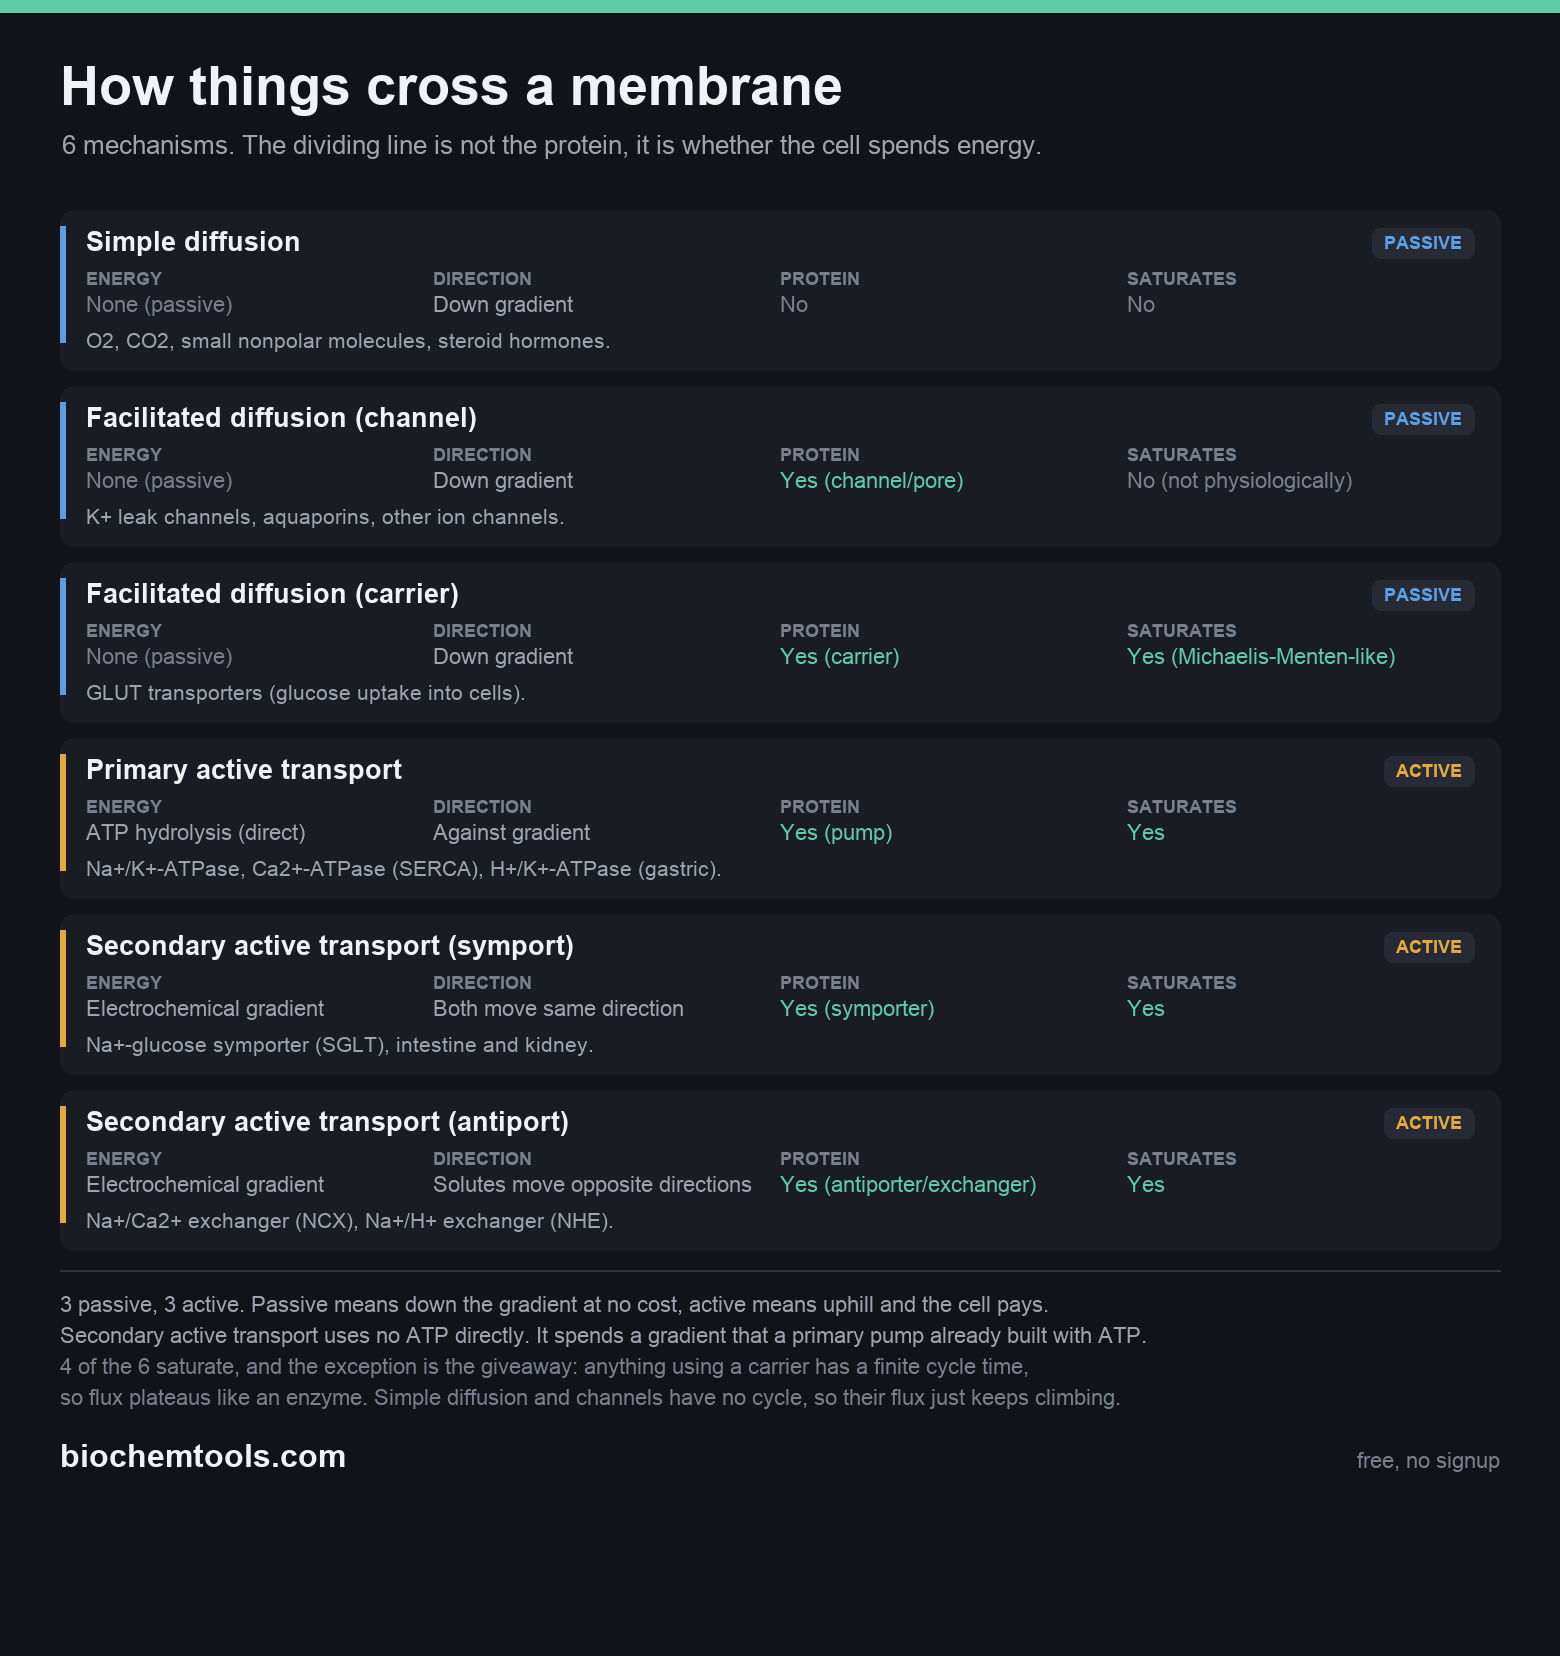
How things cross a membrane
All six transport mechanisms with their energy source, gradient direction, protein involvement and whether they saturate.
Open the interactive version, or download the chart
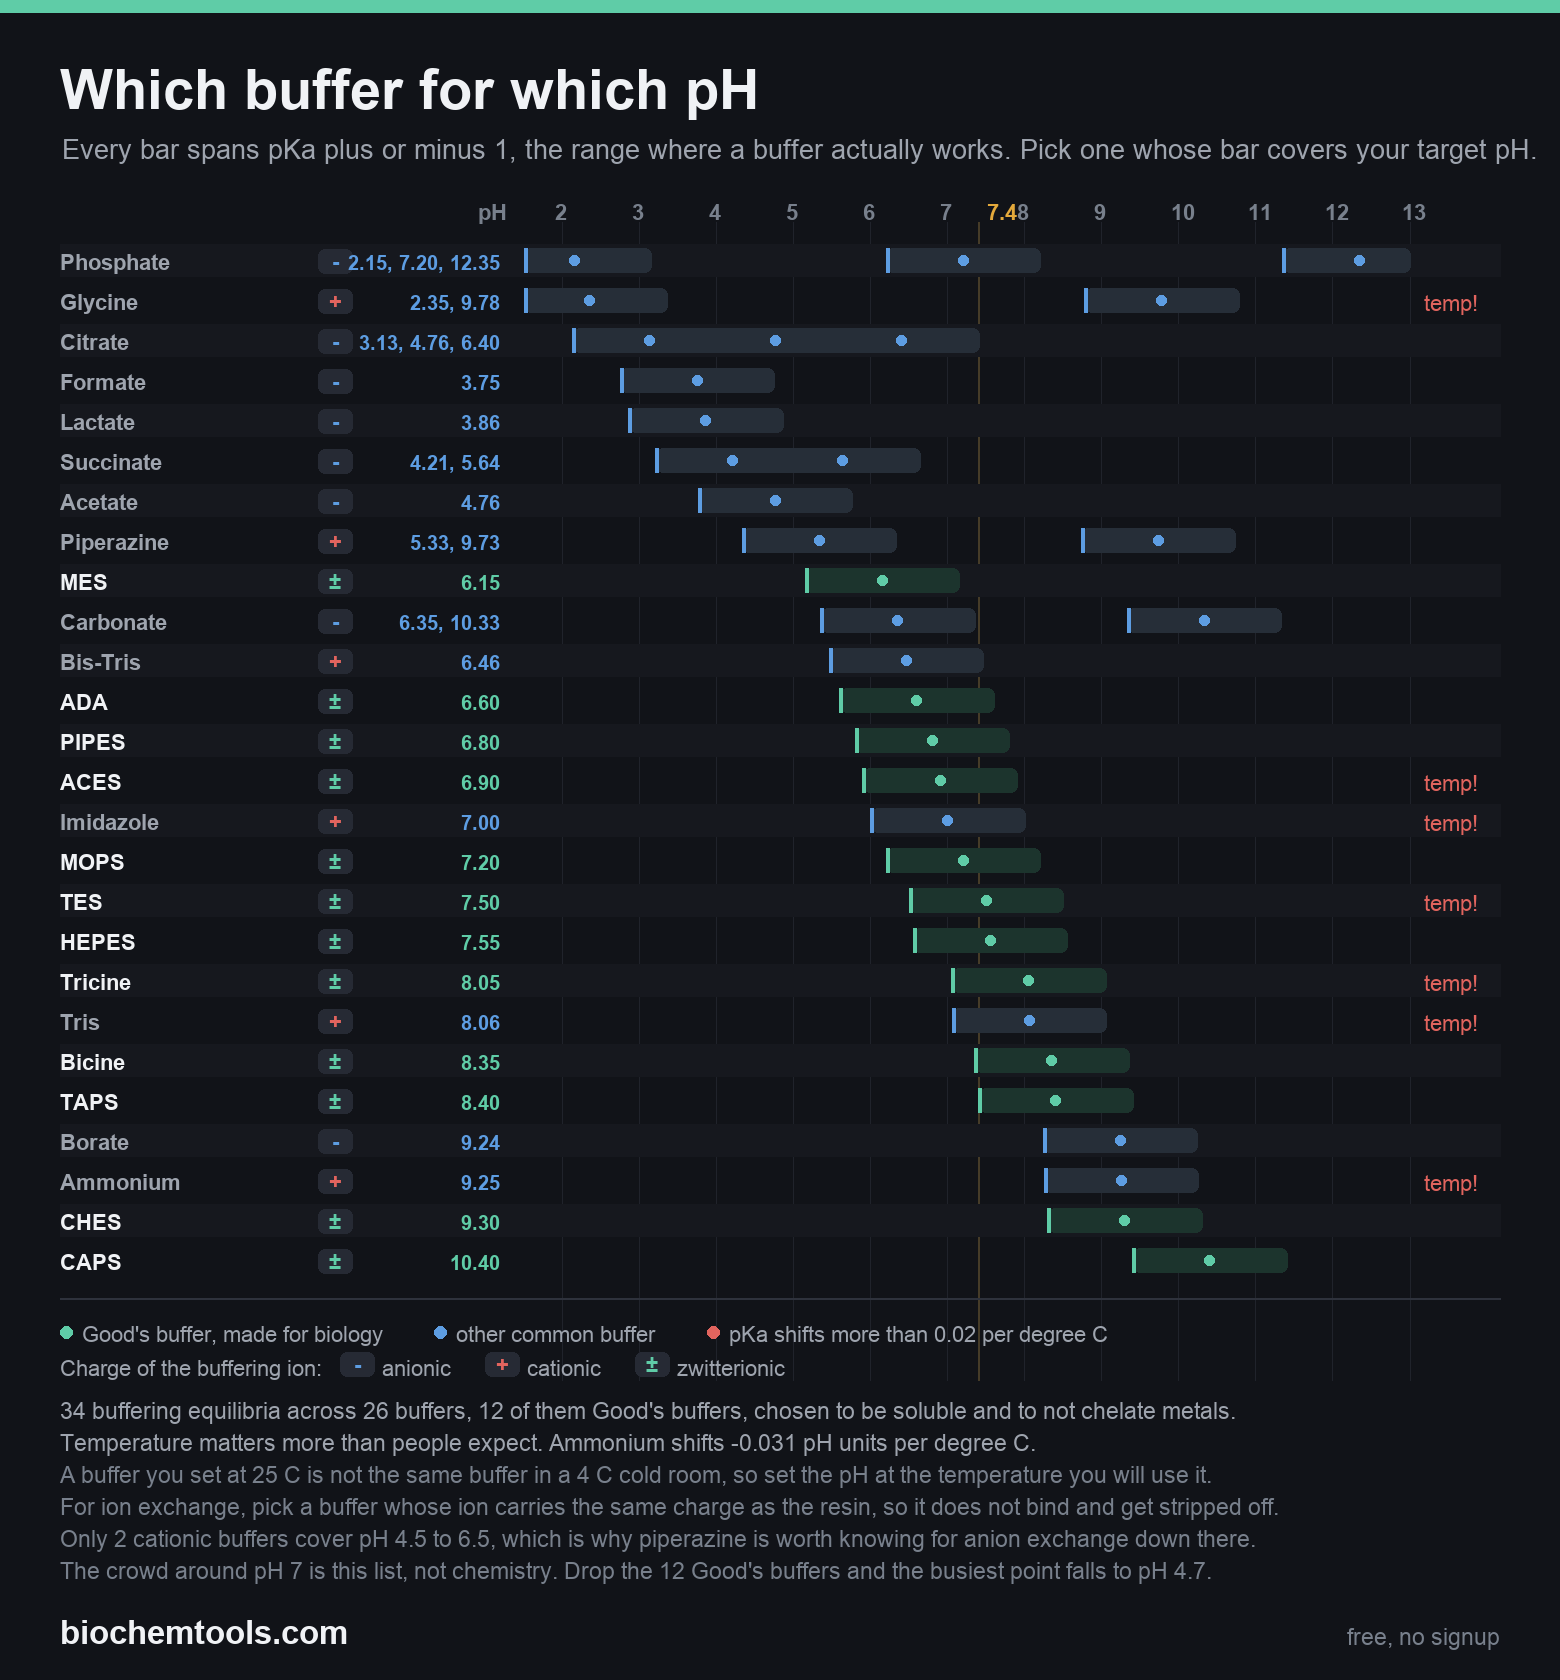
Which buffer for which pH
32 buffers on a pH axis, each spanning its useful range, with Good's buffers and the temperature-sensitive ones marked.
Open the interactive version, or download the chart
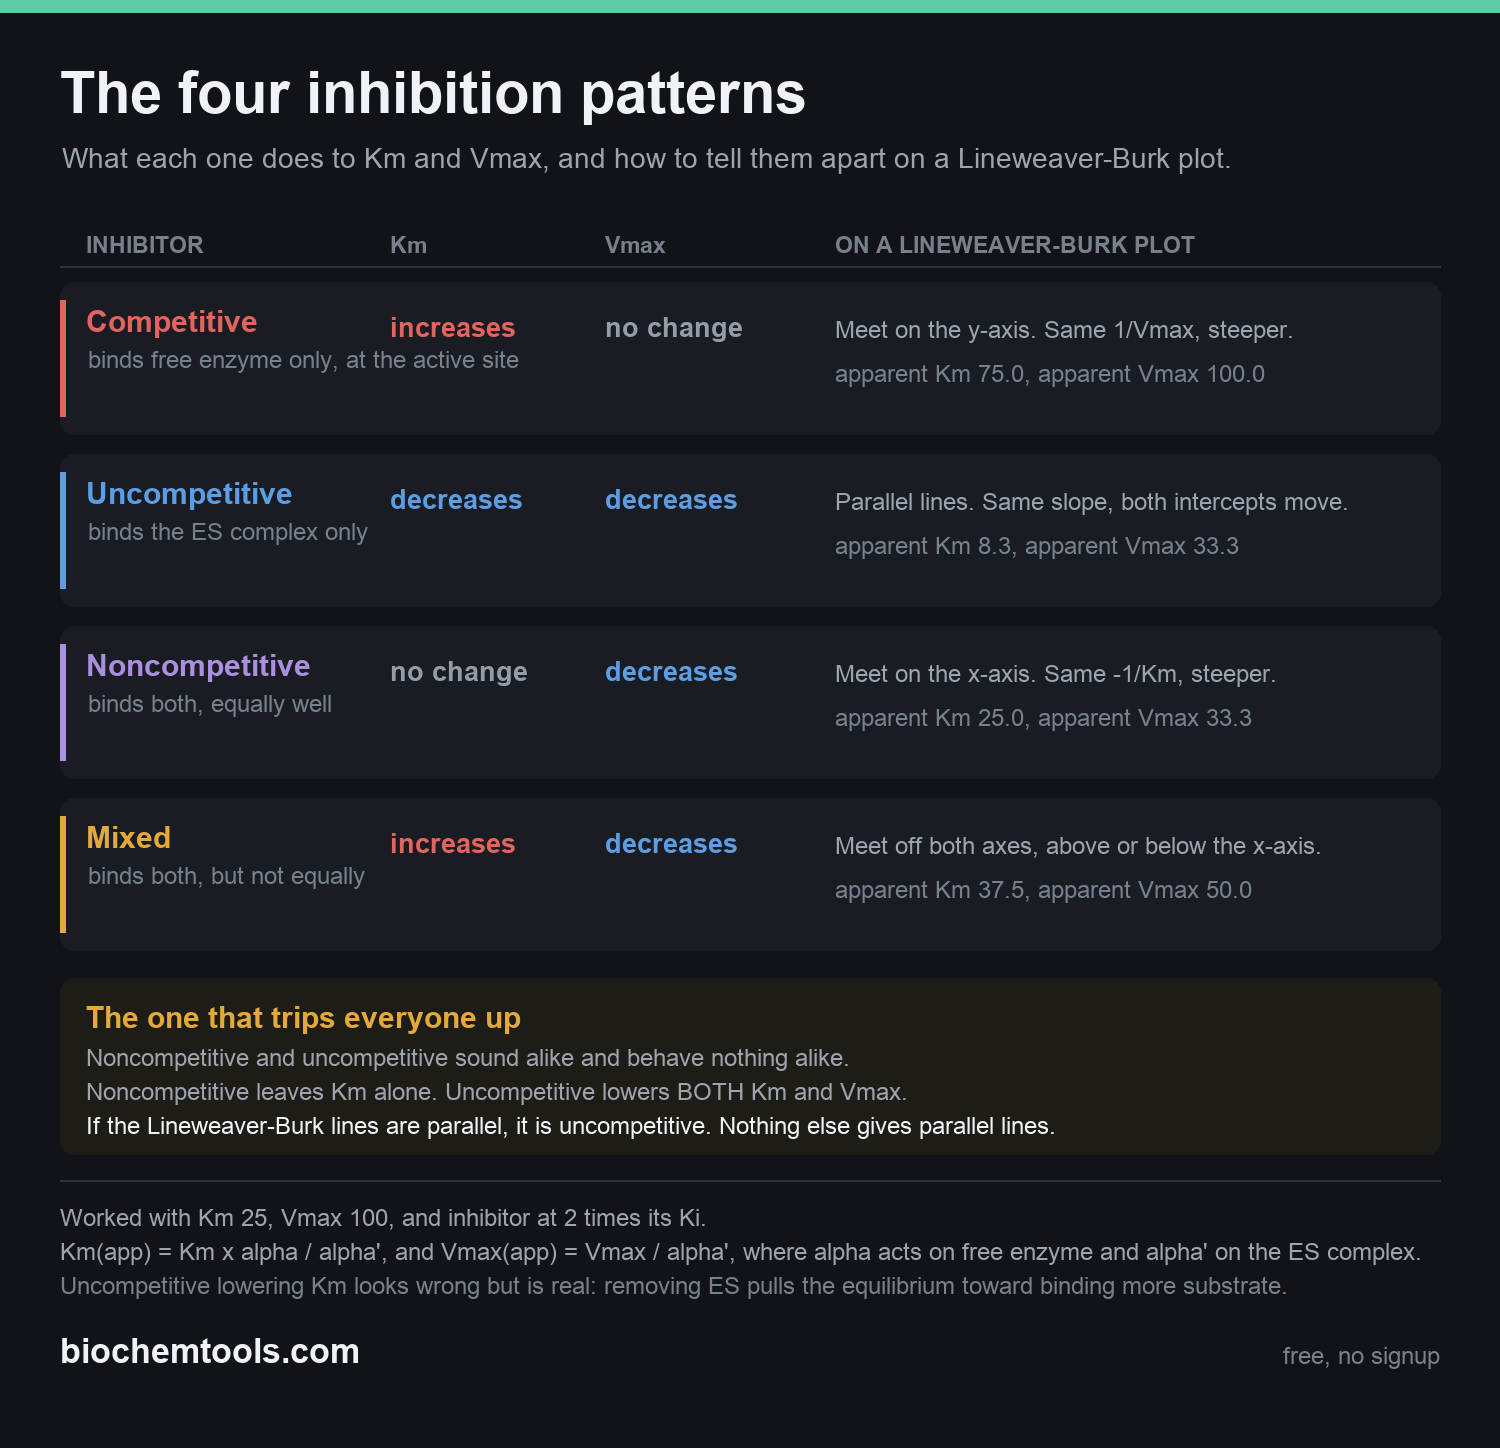
The four enzyme inhibition patterns
Competitive, uncompetitive, noncompetitive and mixed inhibition: the effect of each on Km and Vmax and its Lineweaver-Burk signature.
Open the interactive version, or download the chart
How these are made
Each chart is generated by a script that pulls its values from the live tool page and asserts them before drawing. The amino acid structures come from RDKit and were checked for molecular formula, net charge at pH 7.4, and L-configuration at every stereocentre. The ATP and glycolysis charts sum their own rows and fail the build if the total does not match. The inhibition chart derives every arrow from the Michaelis-Menten equations rather than copying a textbook table.
If you spot something wrong, please say so. Two corrections from readers have already improved these charts.
These charts are licensed CC BY 4.0. Print them, hand them out, put them on a course page or a library guide, even build on them. Just credit biochemtools.com.